Application Note | TURBIDI.T™
How to monitor yeast growth in a bioreactor with TURBIDI.T™?
by Gloria Pinilla and Nora Kasaplar,
Application Scientists, Rheolution Inc.
In colaboration with
École Nationale Supérieure de Technologie des Biomolécules de Bordeaux (ENSTBB).
SUMMARY
- Monitoring yeast growth is a crucial process to ensure optimal conditions and productivity in biotechnological processes.
- Turbidity-based measurements have emerged as a rapid non-destructive approach for estimating yeast growth and tracking culture density over time. TURBIDI.T™ (Rheolution, QC, Canada) has been used to precisely monitor the growth of S. cerevisiae over time.
- Turbidity (850 nm) and absorbance (600 nm) results have been compared demonstrating similar trends and strong correlation.
- TURBIDI.T™ has demonstrated multiple advantages over spectrophotometer toward cell growth analysis and data collection.
INTRODUCTION
In the realm of bioengineering and biotechnology, cells serve as catalysts for the production of diverse valuable products, such as biofuels, pharmaceuticals, antibodies, industrial enzymes, and bio-based chemicals [1]. Within this context, yeast, a widely utilized microorganism, plays a pivotal role. Monitoring yeast growth is of utmost importance to ensure optimal conditions and productivity in biotechnological processes [2].
Traditionally, spectrophotometric analysis has been used to assess the optical density at 600 nm (OD600nm) by measuring the absorption of light by the yeast culture, and monitor the evolution of the turbidity of a cell population. Turbidity-based measurements have emerged as a rapid non-destructive approach for estimating yeast growth and tracking culture density over time. This methodology leverages the principles of light scattering, wherein changes in cell concentration and size influence the intensity of light scattered by the culture. By quantifying the resulting turbidity, valuable insights into the progression of cell growth can be obtained.
Saccharomyces cerevisiae (5-10 µm), also known as baker’s yeast or brewer’s yeast, holds a prominent position as a model organism in the field of industrial production. This is due to its well-characterized nature, robustness, high productivity, and versatility.
This application note focuses on the use of TURBIDI.T™ (Rheolution, QC, Canada) to monitor the growth of S. cerevisiae over time. The obtained results are compared and correlated with OD600nm measurements acquired using a standard spectrophotometer. By examining this comparison, valuable insights can be gained to further understand the efficacy and reliability of TURBIDI.T™ as a yeast growth monitoring tool.
MATERIALS AND METHODS
A yeast pre-culture of 100 mL was prepared under sterile conditions by inoculating S. cerevisiae colonies from a solid culture on a Petri dish, followed by overnight growth. Simultaneously, a 3 L bioreactor (BIOSTAT B; Sartorius Stedim Biotech, Göttingen, Germany) containing sterile synthetic culture medium [3] was prepared for overnight sterilization in an autoclave. The synthetic culture medium consisted of various inorganic salts ((NH4)2SO4, KH2PO4, MgSO4), vitamins, oligo-elements, and glucose. After sterilization, the pH and pO2 probes, as well as the glucose feeding pump, were calibrated following the instructions provided by the BIOSTAT B software (Figure 1).

Figure 1: Bioreactor setup for yeast growing in sterile conditions.
To calibrate the TURBIDI.T™, formazin standards were employed prior to testing. Light emission and reception were enabled using Emitt.805 cartridges (wavelength of 850 nm) and Receiv.ViS cartridges (wavelength ranging from 400 nm to 1000 nm), respectively. We chose using 850 nm cartridge since the effect of light absorbance was lower The spectrophotometer (SAFAS UVmc, SAFAS, Monaco) was calibrated with one vial of deionized distilled water (ddH2O) before each measurement.
The pre-cultured yeasts were seeded into the bioreactor at a density of 220 FTU (0.21 uOD). Subsequently, yeast growth was monitored by taking yeast aliquots every hour for 8 hours. Turbidity at 850 nm (expressed in FTU) and absorbance (expressed in uOD) measurements were performed in triplicate for each time point (n=3). For spectrophotometric measurements, the yeast culture aliquot was diluted at a ratio of 1:100, while for turbidimetric measurements, no dilution was required, and aliquots were tested directly. The results are presented as the mean ± standard deviation.
RESULTS AND DISCUSSION
Figure 2 depicts the growth pattern of yeast over time, exhibiting a notable exponential increase in both turbidity units (FTU) and absorbance units (uOD) following a short latency period of 2 hours. During the latency phase, yeast cells undergo an adaptive period, gradually adjusting to their environment. As this phase concludes, the curve takes off, demonstrating the continuous proliferation of yeast cells. This exponential growth phase indicates the presence of optimal conditions for yeast growth, where factors such as nutrient availability and environmental cues promote active cell division and metabolic activity.

Figure 2: Bioreactor setup for yeast growing in sterile conditions. Turbidity evolution of S. cerevisiae culture over 8h and comparison between turbidity 850 nm and OD600nm.
The measurements obtained using TURBIDI.T™ for turbidity (represented on the left Y-axis) closely align with the absorbance values obtained using a standard spectrophotometer (displayed on the right Y-axis), as both curves exhibit a similar trend. Standard deviations were all very low (error bars included in the graph), demonstrating the high precision of the measurements (variability below 1%).
Consistent with the observations from Figure 2, there is a positive linear correlation between turbidity and OD600nm measurements, with an impressive coefficient of determination (R²) of 0.998 (Figure 3). This high R² value indicates a strong and reliable relationship between turbidity and OD600nm, suggesting that turbidity measurements can effectively serve as a substitute for absorbance-based measurements when monitoring yeast growth.

Figure 3: Correlation between the FTU (850 nm) and uOD (600 nm) in measuring cell culture growth.
The close correspondence between turbidity and absorbance measurements, along with the high correlation coefficient, highlights the efficacy and accuracy of turbidity-based measurements using TURBIDI.T™ for monitoring yeast growth dynamics.
Furthermore, the ability to obtain reliable growth data without the need for sample dilution, as required in traditional spectrophotometric analysis, further emphasizes the advantages offered by the turbidity-based approach. Overall, these findings demonstrate the potential of TURBIDI.T™ as a valuable tool for precise and efficient monitoring of yeast growth in bioprocesses, contributing to advancements in biotechnological research and applications.
CONCLUSIONS AND PRESPECTIVES
- The TURBIDI.T™ system showed to be a powerful and accurate tool for monitoring cell culture growth and kinetics in yeast cultures.
- The comparison between turbidity and OD600nm reveals a strong linear relationship, establishing turbidity as a precise alternative to absorbance-based measurements. This highlights the effectiveness of turbidity in assessing yeast growth dynamics with accuracy.
- TURBIDI.T™ presents several advantages compared with spectrophotometer analysis. The elimination of sample dilution due to the high range of turbidity values read by the TURBIDI.T™ instrument reduces measurement errors and saves valuable time. Additionally, the portable tablet allows for easy data collection and storage, enhancing convenience and accessibility.
- The versatility of the TURBIDI.T™ system can accommodate different vials for measurements for different experimental setups.
- The scalability of the TURBIDI.T™ system further enhances its value. Connecting multiple units to a single operating tablet improves testing efficiency, enabling simultaneous measurements in larger-scale experiments.
REFERENCES
Related Posts
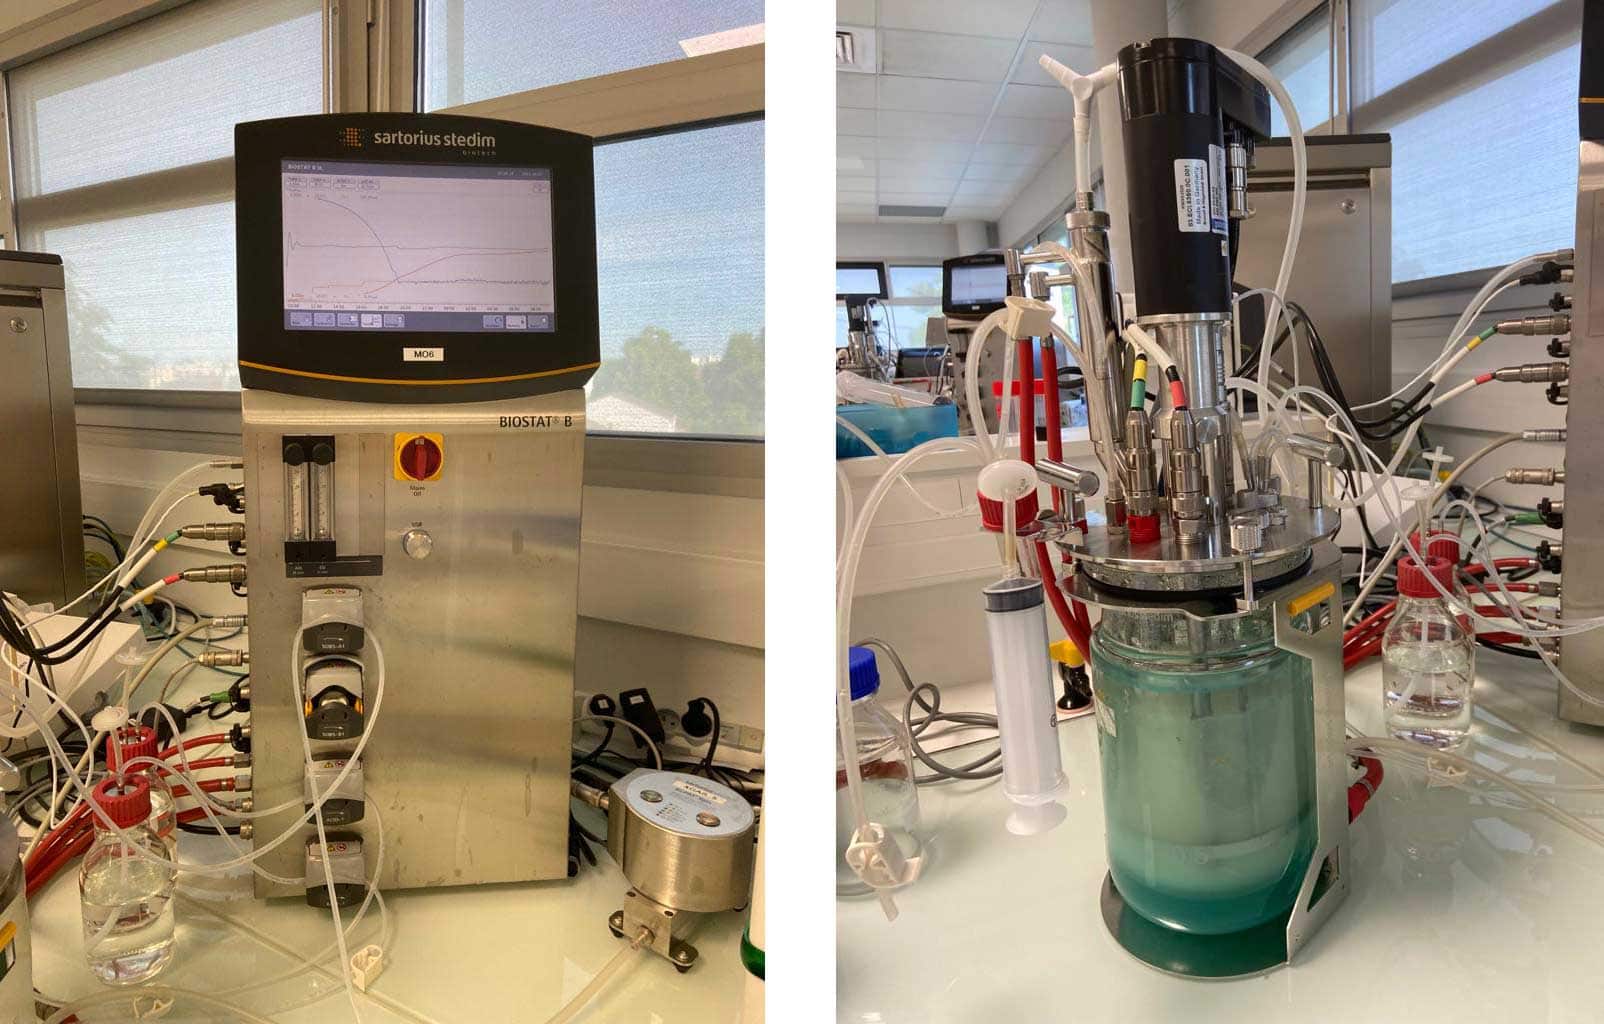
Growing demands for quicker cell quantification methods push beyond traditional cell counting chambers, prompting innovative solutions that facilitate accurate counting while diminishing time. Turbidity, reflecting solution cloudiness in the presence of light scatterers, emerges as an effective means to accelerate cell quantification. In this application note, a strong correlation was established between turbidity (FTU) of a S. cerevisiae culture solution and cell numbers (cells/mL) counted with a conventional cell counting chamber...
The determination of particle size is important in many fields, such as life sciences (nanomedicine, drug delivery, tissue engineering, bioanalysis), chemical, environmental sciences and industries. Turbidimetry is a quick and nondestructive method to estimate particle size following an easy-to-follow procedure. Curves of turbidity vs silica particle concentration in distilled water of various sizes were obtained with high precision using the TURBIDI.TTM. These curves can be used to build a reference curve for the determination of particle size.
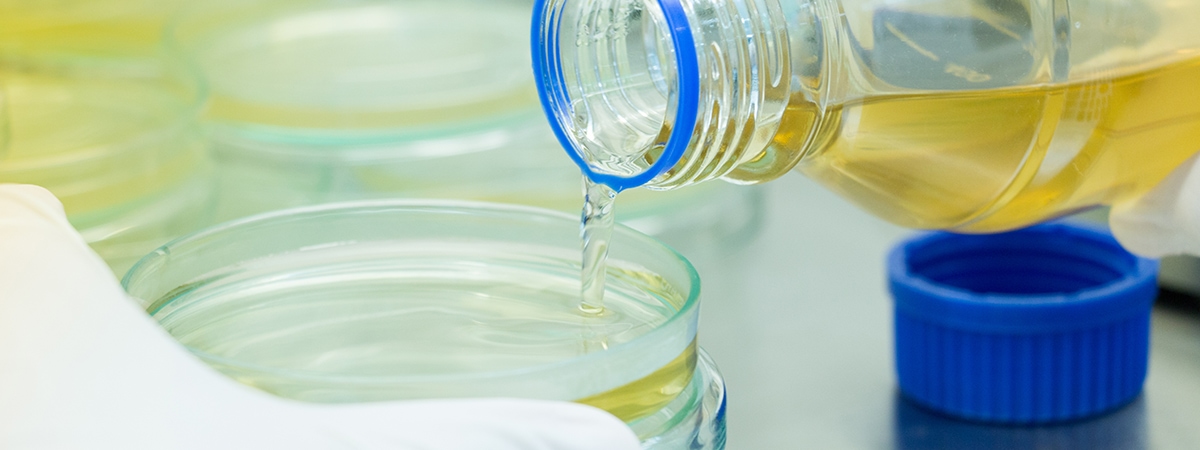
A suspension is a mixture in which solid particles (organic or inorganic in nature) are dispersed in a liquid medium, but not dissolved. Suspensions are usually opaque or cloudy and can settle over time due to gravity. They have a broad range of applications and are present in various industrial processes, such as chemical, pharmaceutical, food and beverage, and environmental industries. During the production of pharmaceutical formulations for example, professionals may measure particle concentration to assess whether particles have aggregated or formed larger clusters to optimize the process and ensure product quality.