


Growing demands for quicker cell quantification methods push beyond traditional cell counting chambers, prompting innovative solutions that facilitate accurate counting while diminishing time. Turbidity, reflecting solution cloudiness in the presence of light scatterers, emerges as an effective means to accelerate cell quantification. In this application note, a strong correlation was established between turbidity (FTU) of a S. cerevisiae culture solution and cell numbers (cells/mL) counted with a conventional cell counting chamber. Utilizing TURBIDI.T™ for accurate turbidity measurements offers a user-friendly...

In the realm of bioengineering and biotechnology, cells serve as catalysts for the production of diverse valuable products, such as biofuels, pharmaceuticals, antibodies, industrial enzymes, and bio-based chemicals [1]. Within this context, yeast, a widely utilized microorganism, plays a pivotal role. Monitoring yeast growth is of utmost importance to ensure optimal conditions and productivity in biotechnological processes [2]. Traditionally, spectrophotometric analysis has been used to assess the optical density at 600 nm (OD600nm) by measuring the absorption of light by the yeast ...

The sedimentation kinetics of suspended particles provides crucial information for optimizing manufacturing and infrastructure across industries, while also contributing to the design of drugs and cell therapies. Turbidimetry is a quick and nondestructive method to precisely determine the sedimentation kinetics of suspended particles. The decrease in turbidity of silica particles in distilled water as a function of time was obtained with high precision using the TURBIDI.TTM. This curve gives information about the sedimentation behavior and rate of the suspended particles ...

The determination of particle size is important in many fields, such as life sciences (nanomedicine, drug delivery, tissue engineering, bioanalysis), chemical, environmental sciences and industries. Turbidimetry is a quick and nondestructive method to estimate particle size following an easy-to-follow procedure. Curves of turbidity vs silica particle concentration in distilled water of various sizes were obtained with high precision using the TURBIDI.TTM. These curves can be used to build a reference curve for the determination of particle size.

A suspension is a mixture in which solid particles (organic or inorganic in nature) are dispersed in a liquid medium, but not dissolved. Suspensions are usually opaque or cloudy and can settle over time due to gravity. They have a broad range of applications and are present in various industrial processes, such as chemical, pharmaceutical, food and beverage, and environmental industries. During the production of pharmaceutical formulations for example, professionals may measure particle concentration to assess whether particles have aggregated or formed larger clusters to optimize the process and ensure product quality.

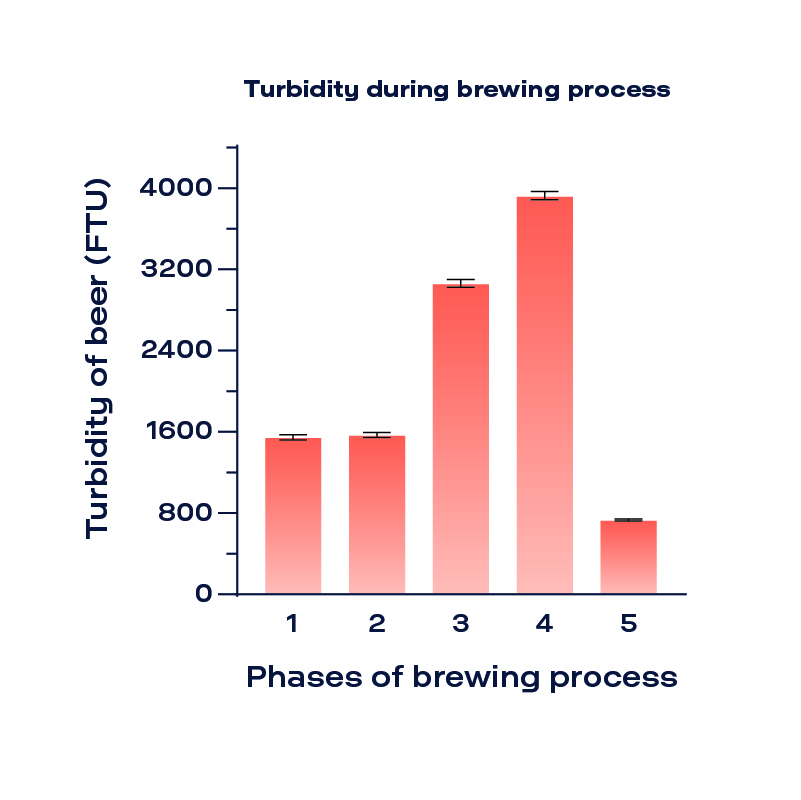
Turbidity provides the consumer’s first visual impression of beer quality. Beer turbidity, technically known as haze, can be a desired or an undesired effect. Industrial beer companies normally choose to filter their beer and follow a precise quality control analysis with the aim of reducing the haze. Consumers expect a filtered beer to be a clear, bright and non-hazy product that remains so during its shelf life. On the other hand, artisanal beers normally have higher haze to maintain their unique flavor and appearance, specially for some types of beers such as New-England Indian Pale Ale (NEIPA).